In another post we handled your manager’s request using Linear Regression in Python. Your manager is also a Spark lover and she wants you to conduct the analysis in PySpark. How would you do it?
The process is pretty similar, other than a few lines of code.
First let’s import the data.


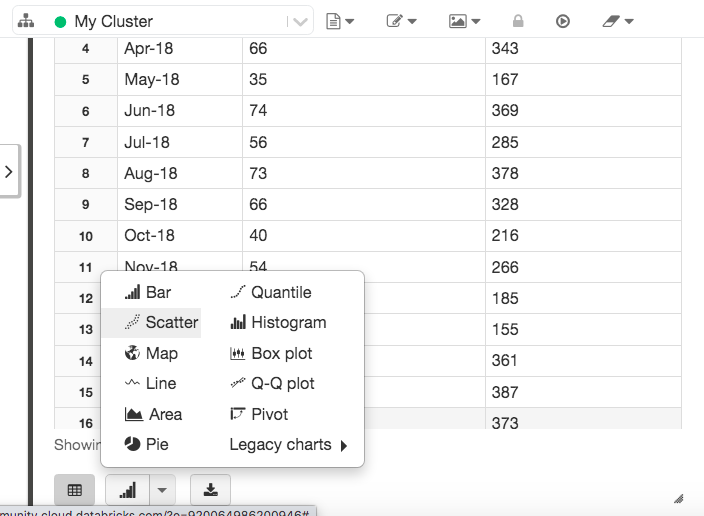
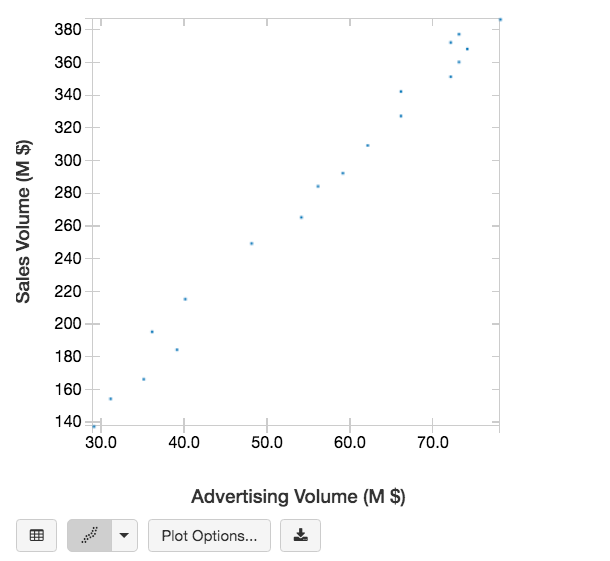
Note by using the ‘display’ function in the PySpark instance (such as Databricks), I can easily change the display table to a scatter chart.
Now let’s use VectorAssembler to transform the features column (Advertising Volume) into a vector.

Then we can conduct a linear regression modelling, and print the results.

Based on the regression results, we also get the below formula:
Sales = 0.43 + 5.03 * Advertising
