In previous post we handled your manager’s request using Linear Regression in Python. Suppose your manager also would like you to conduct the analysis in R. How would you do it?
The process is again very similar, other than the running environment, and a few lines of code.
First let’s import the data.
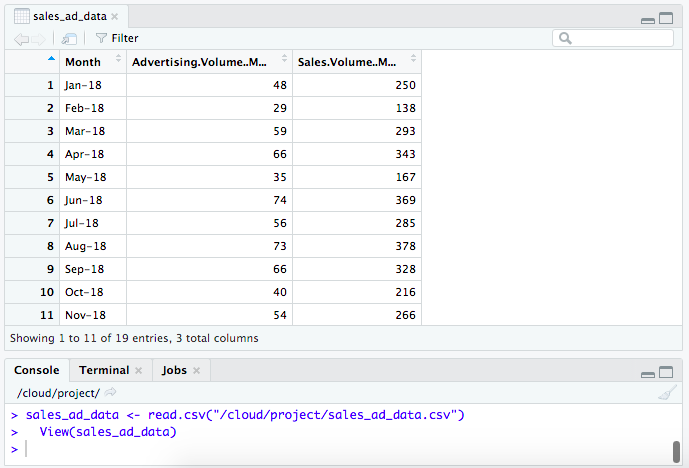
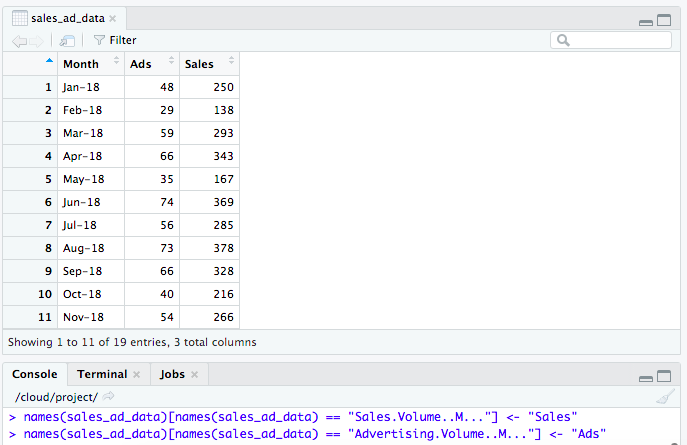
Note the column names are a bit unfriendly. Let’s rename them.
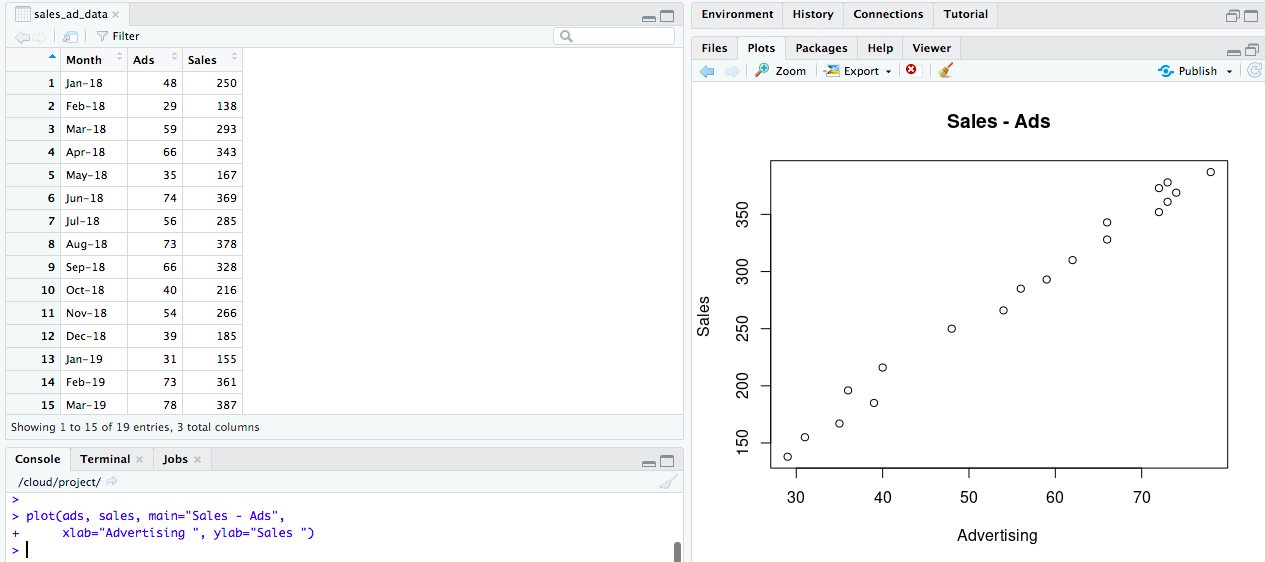
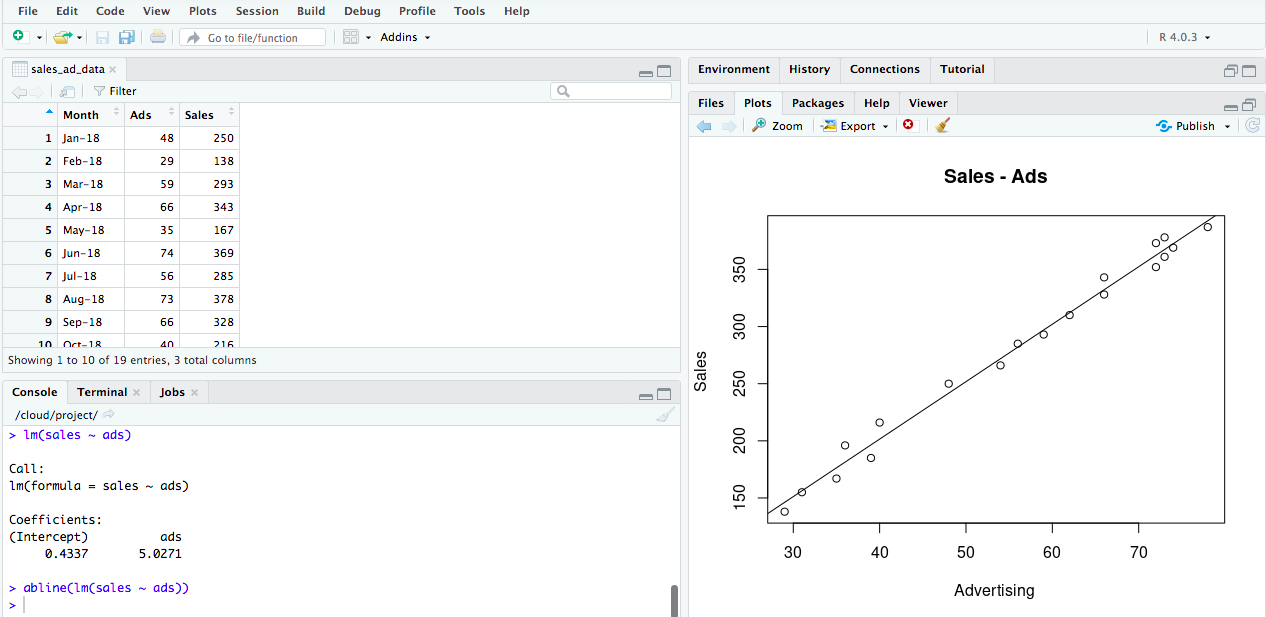
Then we’ll do a quick scatter plot.
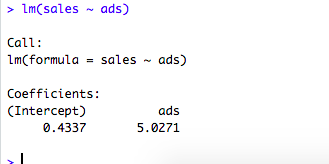
Now let’s print the slope and the intercept.
And we will add the Line Fit to our Plot.
If you want a detailed summary output (similar to Linear Regression in Python), you can do below.
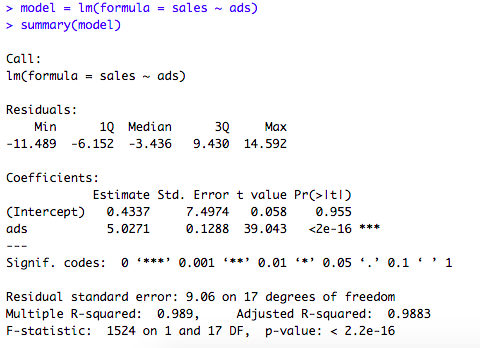
Based on the regression results, we also get the below formula:
Sales = 0.43 + 5.03 * Advertising

One thought on “Linear Regression in R”