Your manager asked you to predict next year’s sales numbers for your company. She suggests you to analyze sales and advertising volume. What methodology will you use?
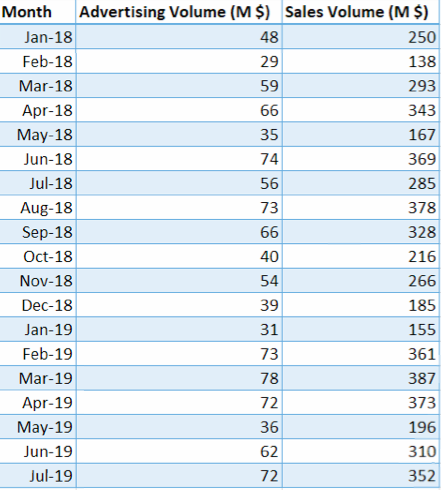
In statistical modeling, Regression is used to determine the strength of the relationship between two or more variables.
Dependent Variable: the variable that you want to predict
Independent Variables: the variables that may affect the dependent variable
Conduct Regression Analysis in Excel:
In your Excel, click File > Options.
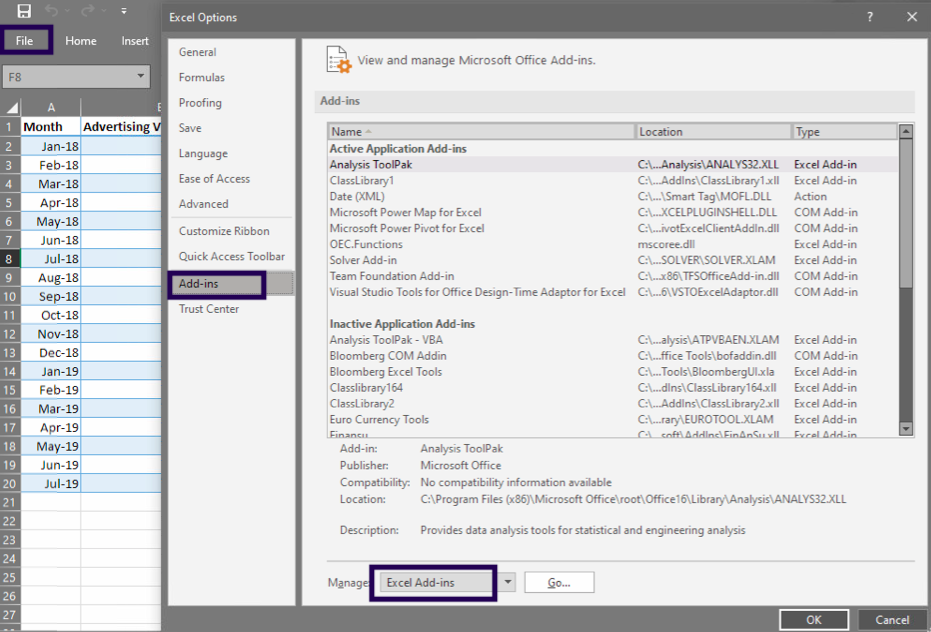
In the Excel Options dialog box, select Add-ins on the left sidebar, make sure Excel Add-ins is selected in the Manage box, and click Go.
In the Add-ins dialog box, tick off Analysis ToolPak, and click OK:
This will add the Data Analysis tools to the Data tab of your Excel ribbon.
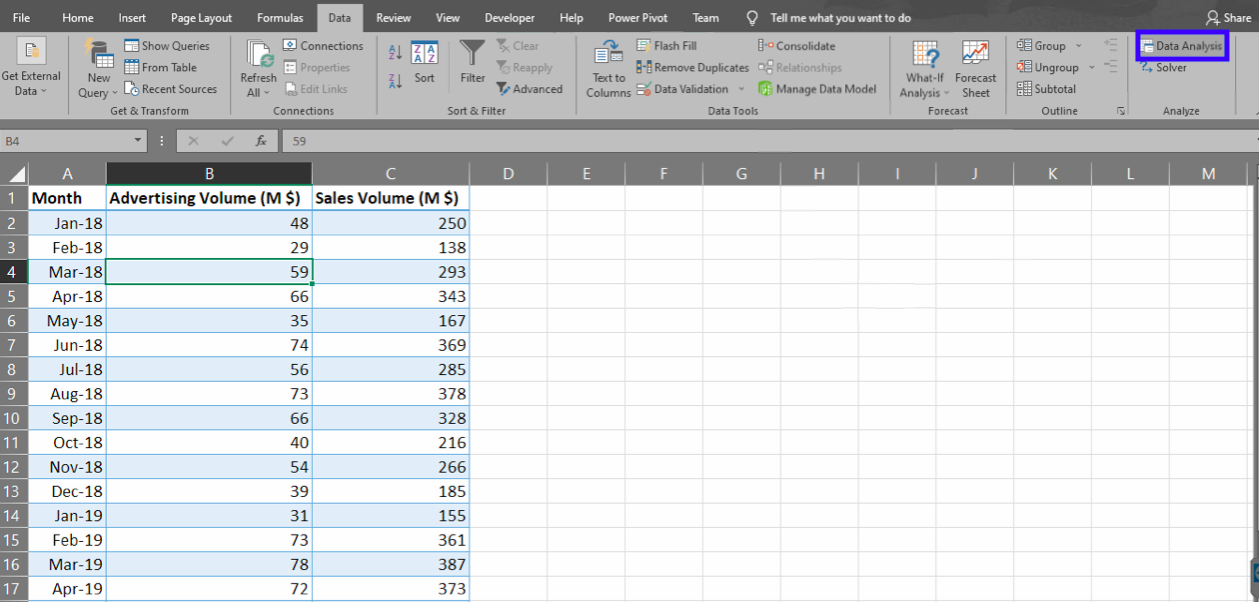
Now click any cell in the data range, go to Data -> Data Analysis. Look for Regression, click OK.
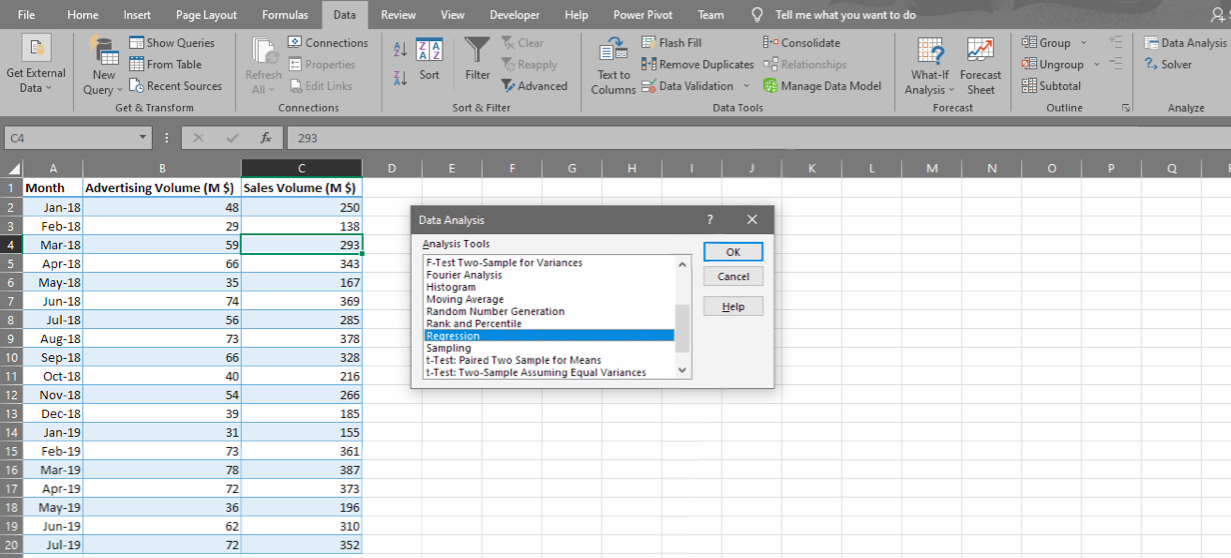
Pick the range for the dependent variable (Y) and the independent variable (X).

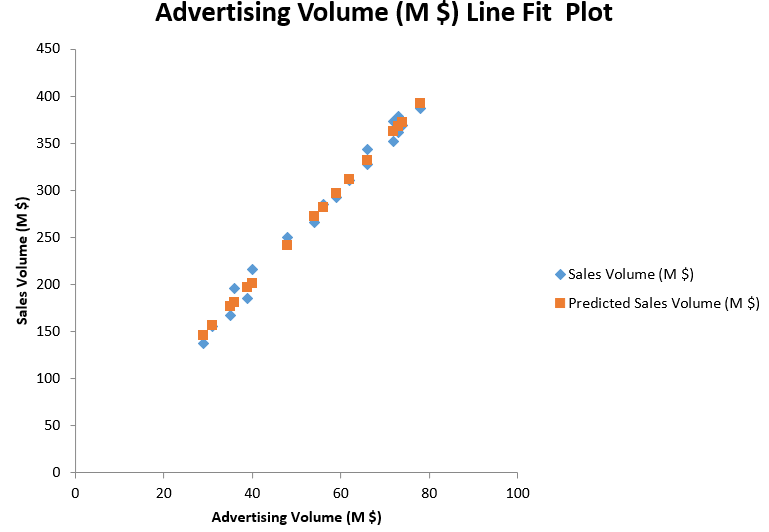
Then you will get a very informative summary output, as well as a Line Fit Plot.
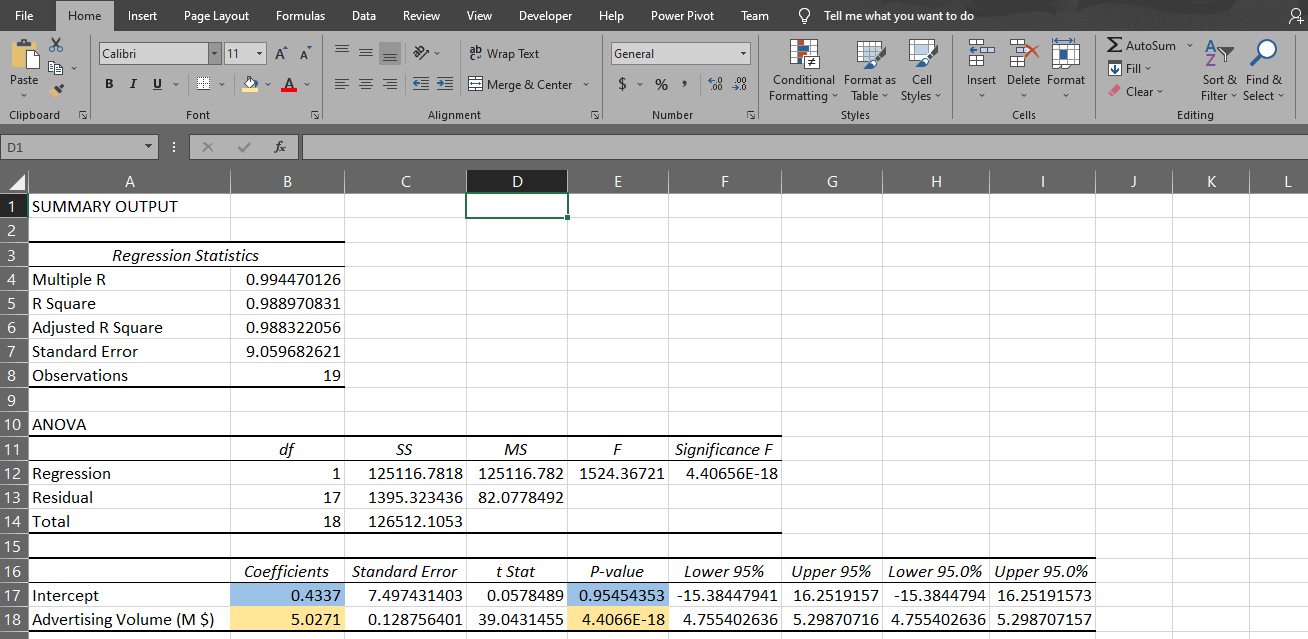
Based on the regression results, we get the below formula:
Sales = 0.43 + 5.03 * Advertising
0.4337 is the intercept coefficient, and 5.0271 is the coefficient for advertising volume. This tells us that when advertising volume increases by $1000, sales volume will increase by around $5027.
Note the p-value for the two coefficients. A p-value lower than 0.05 indicates the result is significantly different from 0. In this case, the intercept (with p-value of 0.95) is not significantly different from 0. However, the coefficient for advertising (with a p-value under 0.05) is significantly different from 0.
We conclude that there is a strong relation between sales volume and advertising volume.
Suppose now your manager wants you to conduct the regression analysis in Python. How will you do it? Watch the next post – Linear Regression in Python.

2 thoughts on “Linear Regression in Excel”